Title here
Summary here
Monitoring of Watermill may be performed by using decorators for publishers/subscribers and middlewares for handlers. We provide a default implementation using Prometheus, based on the official Prometheus client for Go.
The components/metrics package exports PrometheusMetricsBuilder, which provides convenience functions to wrap publishers, subscribers and handlers so that they update the relevant Prometheus registry:
// ...
// PrometheusMetricsBuilder provides methods to decorate publishers, subscribers and handlers.
type PrometheusMetricsBuilder struct {
	// PrometheusRegistry may be filled with a pre-existing Prometheus registry, or left empty for the default registry.
	PrometheusRegistry prometheus.Registerer

	Namespace string
	Subsystem string
	// PublishBuckets defines the histogram buckets for publish time histogram, defaulted if nil.
	PublishBuckets []float64
	// HandlerBuckets defines the histogram buckets for handle execution time histogram, defaulted to watermill's default.
	HandlerBuckets []float64

	additionalLabels []MetricLabel
}

// AddPrometheusRouterMetrics is a convenience function that acts on the message router to add the metrics middleware
// to all its handlers. The handlers' publishers and subscribers are also decorated.
// The default buckets are used for the handler execution time histogram (use your own provisioning
// with NewRouterMiddlewareWithConfig if needed).
func (b PrometheusMetricsBuilder) AddPrometheusRouterMetrics(r *message.Router) {
// ...
Full source: github.com/ThreeDotsLabs/watermill/components/metrics/builder.go
If you are using Watermill’s router
(which is recommended in most cases), you can use a single convenience function AddPrometheusRouterMetrics to ensure that all the handlers added to this router are wrapped to update the Prometheus registry, together with their publishers and subscribers:
// ...
// AddPrometheusRouterMetrics is a convenience function that acts on the message router to add the metrics middleware
// to all its handlers. The handlers' publishers and subscribers are also decorated.
// The default buckets are used for the handler execution time histogram (use your own provisioning
// with NewRouterMiddlewareWithConfig if needed).
func (b PrometheusMetricsBuilder) AddPrometheusRouterMetrics(r *message.Router) {
	r.AddPublisherDecorators(b.DecoratePublisher)
	r.AddSubscriberDecorators(b.DecorateSubscriber)
	r.AddMiddleware(b.NewRouterMiddleware().Middleware)
}
// ...
Full source: github.com/ThreeDotsLabs/watermill/components/metrics/builder.go
Example use of AddPrometheusRouterMetrics:
// ...
// we leave the namespace and subsystem empty
metricsBuilder := metrics.NewPrometheusMetricsBuilder(prometheusRegistry, "", "")
metricsBuilder.AddPrometheusRouterMetrics(router)
// ...
Full source: github.com/ThreeDotsLabs/watermill/_examples/basic/4-metrics/main.go
In the snippet above, we have left the namespace and subsystem arguments empty. The Prometheus client library uses these
to prefix the metric names. You may want to use namespace or subsystem, but be aware that this will impact the metric names and you will have to adjust the Grafana dashboard accordingly.
The PrometheusMetricsBuilder allows for custom configuration of histogram buckets by setting the PublishBuckets or HandlerBuckets field.
If HandlerBuckets is not provided, default watermill’s values will be used, which are one order of magnitude smaller than default buckets (5ms~10s), because the handler execution times are typically shorter (µs~ms range).
For PublishBuckets, the default values are the same as the default Prometheus buckets (5ms~10s).
Standalone publishers and subscribers may also be decorated through the use of dedicated methods of PrometheusMetricBuilder:
// ...
subWithMetrics, err := metricsBuilder.DecorateSubscriber(pubSub)
if err != nil {
	panic(err)
}
pubWithMetrics, err := metricsBuilder.DecoratePublisher(pub)
if err != nil {
	panic(err)
}
// ...
Full source: github.com/ThreeDotsLabs/watermill/_examples/basic/4-metrics/main.go
In accordance with how Prometheus works, the service needs to expose a HTTP endpoint for scraping. By convention, it is a GET endpoint, and its path is usually /metrics.
To serve this endpoint, there are two convenience functions, one using a previously created Prometheus Registry, while the other also creates a new registry:
// ...
// CreateRegistryAndServeHTTP establishes an HTTP server that exposes the /metrics endpoint for Prometheus at the given address.
// It returns a new prometheus registry (to register the metrics on) and a canceling function that ends the server.
func CreateRegistryAndServeHTTP(addr string) (registry *prometheus.Registry, cancel func()) {
	registry = prometheus.NewRegistry()
	return registry, ServeHTTP(addr, registry)
}

// ServeHTTP establishes an HTTP server that exposes the /metrics endpoint for Prometheus at the given address.
// It takes an existing Prometheus registry and returns a canceling function that ends the server.
func ServeHTTP(addr string, registry *prometheus.Registry) (cancel func()) {
// ...
Full source: github.com/ThreeDotsLabs/watermill/components/metrics/http.go
Here is an example of its use in practice:
// ...
prometheusRegistry, closeMetricsServer := metrics.CreateRegistryAndServeHTTP(*metricsAddr)
defer closeMetricsServer()

// we leave the namespace and subsystem empty
metricsBuilder := metrics.NewPrometheusMetricsBuilder(prometheusRegistry, "", "")
metricsBuilder.AddPrometheusRouterMetrics(router)
// ...
Full source: github.com/ThreeDotsLabs/watermill/_examples/basic/4-metrics/main.go
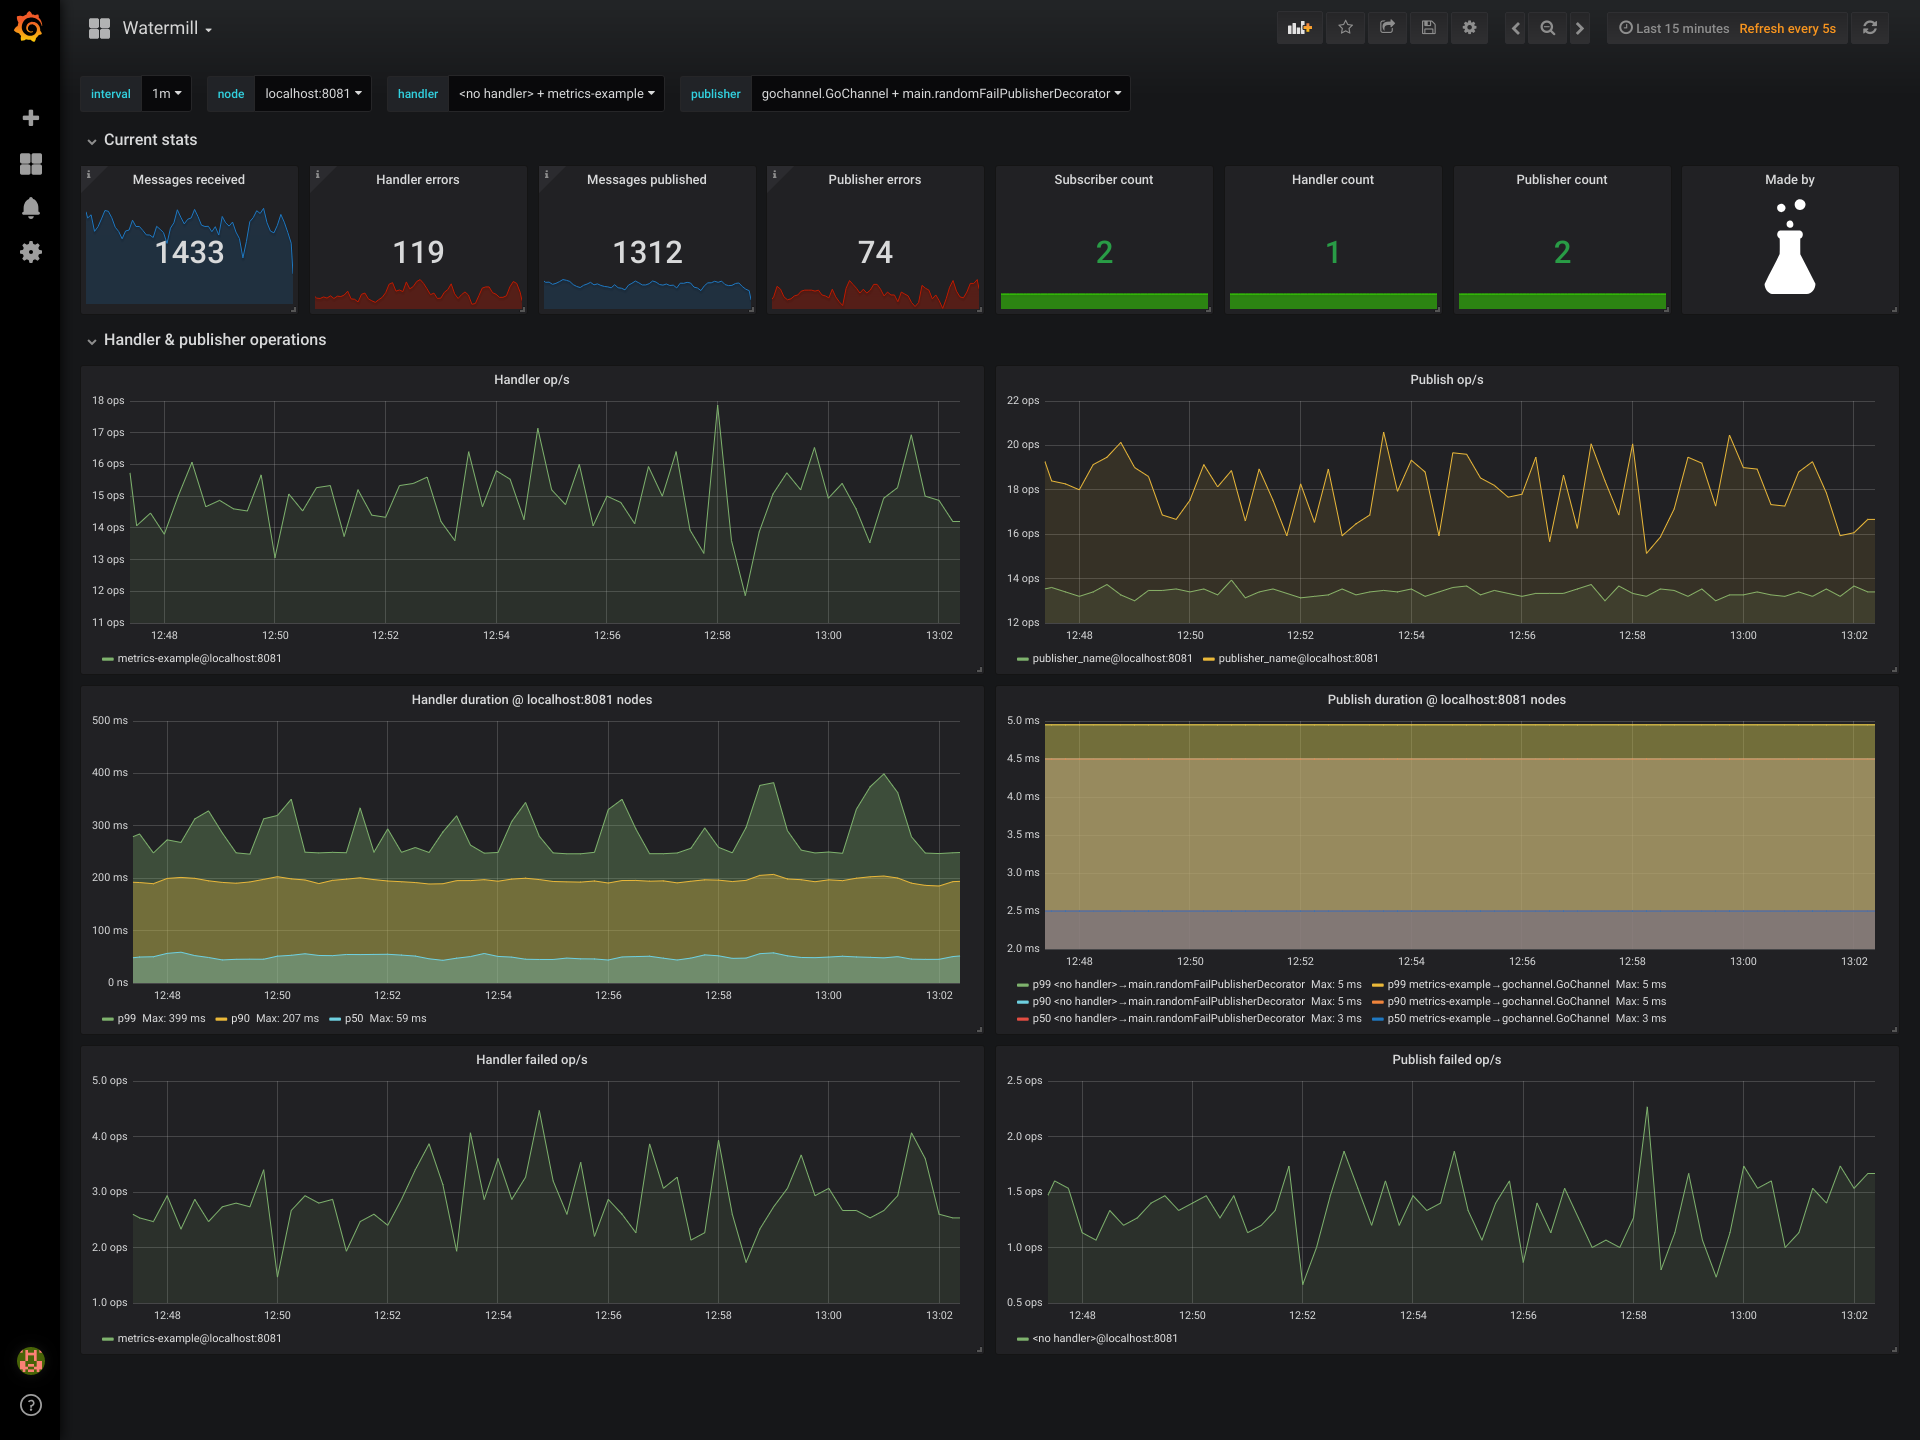
To see how the metrics dashboard works in practice, you can check out the metrics example .
Follow the instructions in the example’s README to make it run and add the Prometheus data source to Grafana.
We have prepared a Grafana dashboard to use with the metrics implementation described above. It provides basic information about the throughput, failure rates and publish/handler durations.
If you want to check out the dashboard on your machine, you can use the Example application .
To find out more about the metrics that are exported to Prometheus, see Exported metrics .
To import the Grafana dashboard, select Dashboard/Manage from the left menu, and then click on +Import.
Enter the dashboard URL https://grafana.com/dashboards/9777 (or just the ID, 9777), and click on Load.
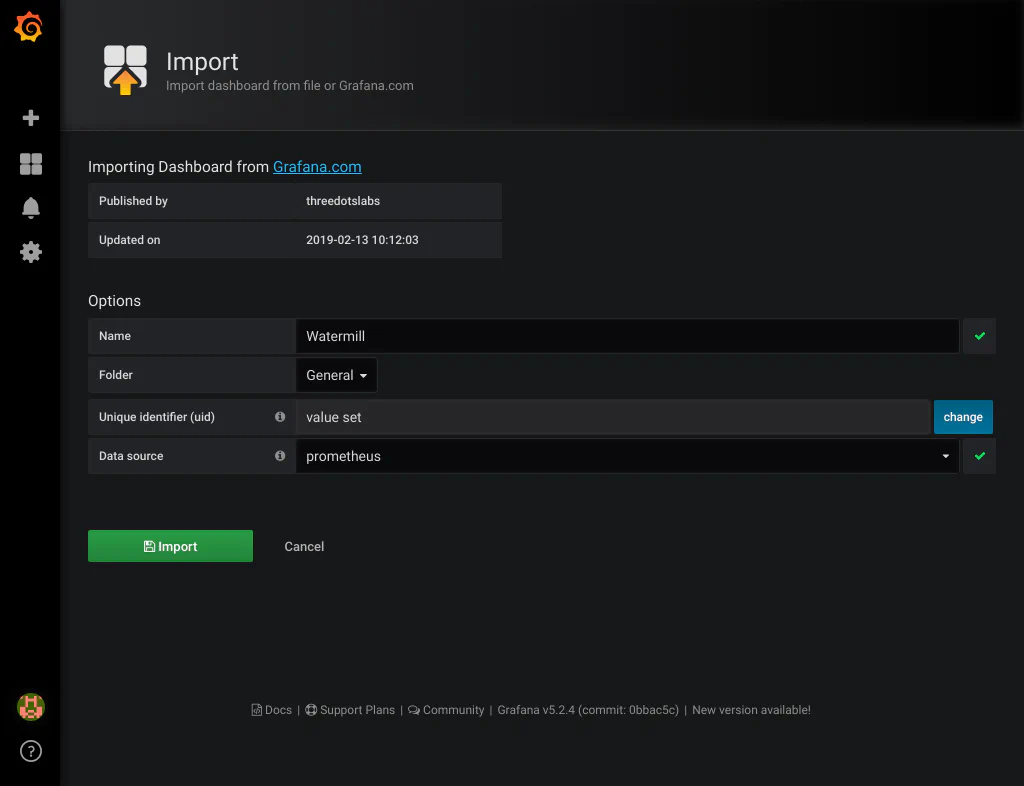
Then select your Prometheus data source that scrapes the /metrics endpoint. Click on Import, and you’re done!
Listed below are all the metrics that are registered on the Prometheus Registry by PrometheusMetricsBuilder.
For more information on Prometheus metric types, please refer to Prometheus docs .
| Object | Metric | Description | Labels/Values |
|---|---|---|---|
| Subscriber | subscriber_messages_received_total | A Prometheus Counter. Counts the number of messages obtained by the subscriber. | acked is either "acked" or "nacked". |
handler_name is set if the subscriber operates within a handler; "<no handler>" otherwise. | |||
subscriber_name identifies the subscriber. If it implements fmt.Stringer, it is the result of `String()`, package.structName otherwise. | |||
| Handler | handler_execution_time_seconds | A Prometheus Histogram. Registers the execution time of the handler function wrapped by the middleware. | handler_name is the name of the handler. |
success is either "true" or "false", depending on whether the wrapped handler function returned an error or not. | |||
| Publisher | publish_time_seconds | A Prometheus Histogram. Registers the time of execution of the Publish function of the decorated publisher. | success is either "true" or "false", depending on whether the decorated publisher returned an error or not. |
handler_name is set if the publisher operates within a handler; "<no handler>" otherwise. | |||
publisher_name identifies the publisher. If it implements fmt.Stringer, it is the result of `String()`, package.structName otherwise. |
Additionally, every metric has the node label, provided by Prometheus, with value corresponding to the instance that the metric comes from, and job, which is the job name specified in the Prometheus configuration file
.
NOTE: As described above
, using non-empty namespace or subsystem will result in prefixed metric names. You might need to adjust for it, for example in the definitions of panels in the Grafana dashboard.
If you feel like some metric is missing, you can easily expand this basic implementation. The best way to do so is to use the prometheus registry that is used with the ServeHTTP method and register a metric according to the documentation of the Prometheus client.
An elegant way to update these metrics would be through the use of decorators:
// ...
// MessageTransformSubscriberDecorator creates a subscriber decorator that calls transform
// on each message that passes through the subscriber.
func MessageTransformSubscriberDecorator(transform func(*Message)) SubscriberDecorator {
	if transform == nil {
		panic("transform function is nil")
	}
	return func(sub Subscriber) (Subscriber, error) {
		return &messageTransformSubscriberDecorator{
			sub:       sub,
			transform: transform,
		}, nil
	}
}

// MessageTransformPublisherDecorator creates a publisher decorator that calls transform
// on each message that passes through the publisher.
func MessageTransformPublisherDecorator(transform func(*Message)) PublisherDecorator {
	if transform == nil {
		panic("transform function is nil")
	}
	return func(pub Publisher) (Publisher, error) {
		return &messageTransformPublisherDecorator{
			Publisher: pub,
			transform: transform,
		}, nil
	}
}

type messageTransformSubscriberDecorator struct {
// ...
Full source: github.com/ThreeDotsLabs/watermill/message/decorator.go
and/or router middlewares .
A more simplistic approach would be to just update the metric that you want in the handler function.